The 4 Ps of Marketing: Product, Price, Place, and Promotion Explained
A business can offer an excellent product and still struggle to attract customers. It might charge the wrong price, sell through channels its audience rarely uses, or fail to explain why its offering is worth buying.
The numbers show how common this is. When CB Insights analysed 101 startup post-mortems, 42% of founders cited "no market need" as a reason they failed, ahead of running out of cash (29%). Another 14% blamed poor marketing, and 17% pointed to a weak or user-unfriendly product (CMO Council, Quake Capital). Every single one of those root causes is a fundamental marketing-mix failure.
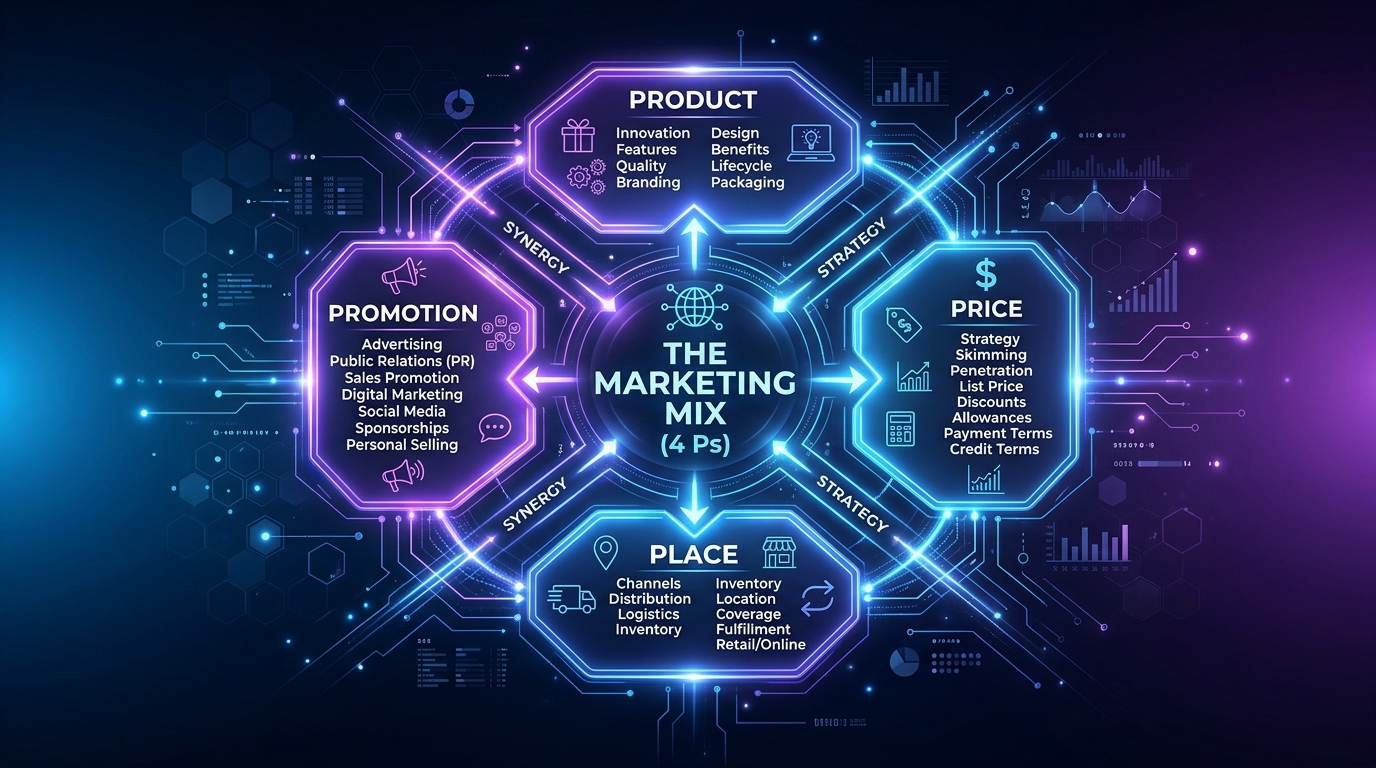
This is where the 4 Ps of Marketing help. Product, Price, Place, and Promotion are the four core pillars of the marketing mix. Together, they guide you in deciding what to offer, how much to charge, where to make it available, and how to effectively communicate its true value to buyers.
In This Comprehensive Guide, You Will Learn:
- ✓ What each of the 4 Ps means with concrete real-world business examples
- ✓ The research-backed empirical numbers behind pricing leverage, distribution shifts, promotional ROI, and retention
- ✓ How the 4 Ps are applied in practice to modern digital SaaS platforms like AI Digital Genius
- ✓ A step-by-step strategy workflow and a copyable fill-in 4 Ps Planning Worksheet
- ✓ Which key performance indicators (KPIs) to track for each P and critical mistakes to avoid
- ✓ How the traditional 4 Ps compare directly against the service-oriented 7 Ps and the customer-centric 4 Cs
What Are the 4 Ps of Marketing?
The 4 Ps of Marketing are Product, Price, Place, and Promotion. Together they form the marketing mix: the coordinated set of controllable tactical decisions a business uses to bring an offering to market, satisfy target customers, and generate sustainable profit.
A short history: Harvard Business School professor Neil Borden popularised the term "marketing mix" in the 1950s, describing a dozen ingredients a marketing manager blends together like a chef preparing a recipe. In 1960, marketing scholar E. Jerome McCarthy simplified those ingredients into four memorable categories in his landmark textbook Basic Marketing: A Managerial Approach. More than six decades later, the 4 Ps remain one of the most durable, widely taught frameworks in business schools and boardrooms worldwide.
The Four Fundamental Questions
Every commercial offering must resolve four foundational operational questions:
| Element | Core Meaning | Key Question Answered | Example Tactical Decisions |
|---|---|---|---|
| Product | What your business offers to the market | What customer problem does it solve? | Core features, build quality, UX design, branding, packaging, support, warranties |
| Price | What customers pay to acquire or use it | Does the price reflect the perceived value? | List price, discounting structure, subscription tiers, payment terms, free trials |
| Place | Where and how customers discover and access it | Where can customers conveniently buy it? | Online web store, mobile apps, third-party marketplaces, physical retail, wholesale logistics |
| Promotion | How you communicate its value to buyers | How will your target audience learn about it? | Search engine optimisation (SEO), content marketing, paid advertising, email campaigns, PR |
The four elements are inextricably connected. A strategic shift in one element almost always triggers changes across the other three. Launching a luxury, premium product, for instance, typically commands a higher price point, exclusive distribution channels (place), and brand storytelling that emphasizes craftsmanship and prestige rather than bargain discounting (promotion). A foundational test of any complete marketing plan is whether all four Ps tell the exact same coherent story to the exact same customer.
1. Product: What Are You Offering?
Product refers to the physical goods, digital software solutions, or expert services you provide. A commercially successful product does not merely exist as a bundle of specifications; it directly addresses an acute customer pain point, removes friction, or delivers an outcome customers value enough to pay for.
Why it matters: Product decisions are where the vast majority of commercial failures originate. In CB Insights' famous post-mortem analysis of failed startups, 17% pointed to a weak or user-unfriendly product and 14% admitted they failed because they were not customer-centric. Customer expectations continue to climb: comprehensive research by Salesforce revealed that 73% of customers expect companies to understand their unique needs, yet only 51% say companies actually do. That 22-point perception gap represents a massive opportunity for businesses that build customer-first products.
Important Product Considerations
When engineering or refining your product offering, evaluate these core criteria:
- Customer Needs: What specific problem are your target buyers trying to eliminate, and how urgent or painful is it?
- Core Benefit vs. Features: Customers do not buy software feature lists; they buy outcomes (e.g., "save three hours every week," "rank higher in search," or "generate an actionable marketing plan in 10 minutes").
- Quality & Reliability: Does your product deliver a dependable, frictionless user experience every single time?
- Design & Usability: Can a first-time user understand and navigate the interface without requiring extensive onboarding or human intervention?
- Differentiation: Why should a prospect choose your product over direct rivals, indirect alternatives, or simply doing nothing?
- Product Architecture: Will you offer a single hero product, or an organized tier structure with good, better, and best options?
- Branding & Packaging: Does your name, visual identity, and packaging signal the intended tier of quality?
- Support & Guarantees: What reassurance, customer support, or money-back guarantees exist if something falls short of expectations?
Think in Three Levels of Product
In modern marketing theory, products are analyzed in three distinct concentric layers. Competing on outer layers is often substantially more cost-effective and defensible than attempting to constantly rebuild the core layer:
| Product Level | What It Represents | Online Clothing Store Example | Digital SaaS Platform Example |
|---|---|---|---|
| 1. Core Benefit | The fundamental need or emotional desire the customer is fulfilling | Looking polished and professional at work without overspending | Growing business revenue and organic search visibility effortlessly |
| 2. Actual Product | The tangible features, styling, quality level, specifications, and brand name | Wrinkle-resistant shirts, tailored trousers, consistent European sizing | AI Marketing Plan Generator, automated SEO keyword models, clean PDF exports |
| 3. Augmented Product | The non-tangible extras, customer support, warranties, and post-purchase services | Free size exchanges, curated style guides, 30-day no-hassle return policy | Interactive Marketing Plan Guide, priority live chat support, educational tutorials |
Adjusting the Mix Across the Product Life Cycle
A product is never static. Its stage within the Product Life Cycle (PLC) dictates how the other three Ps must adapt:
| PLC Stage | Product Focus | Price Strategy | Place (Distribution) | Promotion Strategy |
|---|---|---|---|---|
| Introduction | Prove core value proposition; fix early UX friction | Penetration pricing, freemium, or introductory launch offers | Few, carefully chosen direct channels | Build awareness, educate the market on use cases |
| Growth | Add requested features, expand variants and integrations | Hold prices steady or optimize based on segment demand | Expand rapidly into more channels and marketplaces | Build strong brand preference over emerging rivals |
| Maturity | Differentiate, refresh branding, protect market share | Defend margins; bundle features against price-cutting rivals | Maximize channel coverage and partnership distribution | Retention campaigns, customer loyalty incentives, win-backs |
| Decline | Simplify catalog, sunset underused features, reposition | Cut prices or harvest remaining high-margin segments | Drop unprofitable or high-commission channels | Minimal, strictly targeted marketing expenditure |
Product Example — Online Clothing Store: Rather than trying to be everything to everyone with generic fast fashion, an e-commerce boutique focuses specifically on young corporate professionals who need comfortable, affordable office attire. The collection is intentionally curated: tailored chinos, non-iron dress shirts, coordinated outfits, and accurate measurement tools. Because poor garment fit accounts for up to 30% of fashion e-commerce returns, detailed sizing algorithms and free exchanges are treated as core components of the product experience itself, not operational afterthoughts.
5 Critical Questions to Evaluate Your Product:
- Who is your ideal customer profile (ICP), down to their daily workflow and frustrations?
- What exact problem does the product solve, and how are customers solving it today without you?
- What specific capability or outcome makes it genuinely superior to direct and indirect alternatives?
- Which features do customers actively utilize, and which are virtually ignored?
- What would compel an existing customer to enthusiastically recommend this product to their peers?
Actionable Tip: Never assume you know what features customers want. Interview 5 to 10 prospective buyers before writing code or manufacturing inventory, then rigorously monitor retention, support tickets, and churn drivers after launch.
2. Price: How Much Should Customers Pay?
Price is the financial consideration a customer exchanges to access, purchase, or subscribe to your offering. Crucially, price is the only element of the 4 Ps that directly generates revenue; the other three (product development, place distribution, and promotional marketing) represent operating costs.
Why it matters: Tiny pricing adjustments produce extraordinary changes in bottom-line profitability. An empirical analysis of the average S&P 1500 enterprise conducted by McKinsey & Company ("The Power of Pricing") established that a 1% improvement in price, assuming sales volume remains stable, increases operating profit by approximately 8%.
Operating Profit Lift
Generated from a mere 1% price increase (McKinsey Study)
Cost-Cut Profit Lift
Generated from a 1% cut in variable costs
Volume Growth Lift
Generated from a 1% increase in sales volume
A 1% price increase creates nearly 50% more profit impact than a 1% variable cost reduction and over three times the impact of an equivalent 1% increase in unit sales. Conversely, uncalculated discounting destroys margins: a 1% price reduction erodes operating profits by roughly 8%. Beyond margins, price acts as a psychological signaling mechanism: price your solution too high and you alienate buyers who cannot justify the return; price it too low and prospective customers will question the quality and reliability of your brand.
Common Pricing Strategies
Selecting the right pricing architecture depends on your cost baseline, competitive landscape, and customer willingness to pay:
| Pricing Strategy | How It Operates | Best Suited For | Key Risk / Watch Out For |
|---|---|---|---|
| Cost-plus | Unit production cost + predetermined markup percentage (e.g., $20 cost + $10 margin = $30 list price) | Wholesale, manufacturing, construction, contract consulting | Completely ignores customer perceived value and willingness to pay |
| Competitive | Benchmarking prices directly against market leaders and adjacent rivals | Crowded commodity markets where buyers actively price-compare | Can ignite catastrophic race-to-the-bottom price wars |
| Value-based | Pricing according to the quantifiable ROI, revenue, or time saved for the customer | B2B SaaS, enterprise software, proprietary consulting | Requires rigorous customer research and empirical value proof |
| Penetration | Aggressively low introductory pricing designed to seize market share quickly | New entrants entering entrenched, highly competitive categories | Price-sensitive early adopters may churn when rates normalize |
| Price Skimming | Setting premium launch prices for innovators, gradually lowering prices over time | Groundbreaking tech hardware, patents, first-to-market software | High initial margins rapidly invite well-capitalized copycat rivals |
| Psychological | Charm pricing ($9.99 vs. $10) or anchor tiers making mid-tier plans look like bargains | Consumer e-commerce, digital products, subscription software | Overuse can damage brand prestige or feel deceptive |
| Freemium / Free Trial | Free baseline tier or timed trial to eliminate adoption friction and convert to paid | SaaS apps, self-serve developer tools, mobile applications | Non-paying users still incur server, database, and support expenses |
| Bundling | Packaging multiple complementary products together at a discounted total rate | Increasing Average Order Value (AOV), enterprise software suites | Obscures true customer demand for individual standalone components |
Real-World SaaS Benchmarks: What to Expect from Free Tiers & Trials
If your digital product incorporates freemium access or product-led growth, set realistic conversion expectations. A benchmark study of 86 SaaS providers conducted by First Page Sage (compiled via Nalpeiron) reveals the exact funnel trade-offs between signup friction and conversion velocity:
| SaaS Funnel Model | Visitor-to-Signup Rate (Organic) | Signup-to-Paid Conversion Rate (Organic) | Strategic Takeaway |
|---|---|---|---|
| Freemium Tier | 13.3% | 2.6% | Maximizes user adoption and top-of-funnel reach; relies on high volume |
| Free Trial (No Credit Card Required) | 8.5% | 18.2% | Balanced friction; gives prospects immediate hands-on value with strong intent |
| Free Trial (Credit Card Upfront) | 2.5% | 48.8% | High signup friction weeds out casual users; delivers highly qualified conversions |
Price Example — Subscription Software Packaging: Consider an online project management SaaS tool implementing a classic 3-tier value matrix:
- Free Tier ($0/month): Core task tracking for individuals. Designed to generate word of mouth, fuel bottom-up adoption, and establish a large active user base.
- Professional Tier ($19/seat/month): Real-time collaboration, Gantt charts, and custom reporting for small teams. This is the primary tier most commercial customers are guided toward.
- Business / Enterprise Tier ($49/seat/month): SAML single sign-on, advanced role permissions, audit logging, and dedicated SLA support. In addition to serving enterprise buyers, its higher price point acts as an anchor that makes the $19 plan feel like outstanding value. You can explore a real-world example on our transparent SaaS pricing page.
5 Questions to Audit Your Pricing Model:
- What are your total variable and fixed costs per user (including cloud compute, APIs, and payment gateway fees)?
- What do direct competitors charge, and exactly what limits or capabilities are included at each tier?
- What measurable financial value (revenue expansion, cost reduction, risk mitigation) does your solution create for clients?
- Does your pricing structure match how buyers prefer to pay (usage-based, seat-based, or flat-rate annual)?
- Can you maintain a healthy 70%+ gross margin as your customer base scales over time?
Actionable Tip: Re-evaluate your pricing strategy at least once per year. Test price increases on incoming cohorts first, and closely observe changes in visitor-to-paid conversion rates and 90-day churn before applying changes site-wide.
3. Place: Where Can Customers Find Your Product?
Place (also referred to as distribution) covers the channels, platforms, and locations through which customers discover, purchase, and receive your offering. Historically, place meant brick-and-mortar storefronts, wholesalers, and physical supply chains; in the modern economy, place encompasses responsive websites, mobile apps, digital marketplaces, API ecosystems, and social commerce storefronts.
Why it matters: Consumer and commercial buying habits are experiencing a seismic shift. Global retail e-commerce sales reached approximately $6.88 trillion in 2026, representing 21.1% of all worldwide retail transactions, with over 2.77 billion people actively buying online (eMarketer / SaleHoo forecasts).
Global Online Retail Sales Passing $7.8 Trillion by 2028
Retail e-commerce sales (US$ trillions) and e-commerce share of total global retail (eMarketer Feb 2026 update)
Three Data Points Shaping Distribution in 2026
- Mobile Dominates Traffic, but Converts at Half the Desktop Rate: Mobile smartphones and tablets account for 78% of retail site traffic and 59% of online purchases. However, mobile devices convert at approximately 1.8% compared to roughly 3.0% on desktop (Web Tonic 2026). A sluggish, high-friction mobile checkout is not merely a UI flaw—it is a distribution breakdown.
- Social Platforms Have Evolved into Digital Storefronts: In-app social commerce (TikTok Shop, Instagram Checkout, YouTube Shopping) is forecast to surpass $100 billion in the US alone in 2026 (Wiser Review).
- Omnichannel Customers Deliver Far Higher Lifetime Value: A landmark Harvard Business Review study tracking 46,000 retail shoppers revealed that 73% engaged across multiple channels. Compared to single-channel shoppers, omnichannel buyers spent 4% more in physical stores, 10% more online, and made 23% more repeat store visits within six months (HBR / Accelerated Analytics).
Comparing Distribution Channels
| Distribution Channel | Core Strategic Strengths | Trade-offs & Challenges |
|---|---|---|
| Proprietary Website / Web App | Complete control of brand experience, 100% margin capture, direct customer relationship | You carry 100% of the burden and expense of generating web traffic |
| Online Marketplaces (Amazon, App Store) | Enormous built-in customer intent, frictionless checkout, instant buyer trust | Hefty transaction commissions (15-30%), aggressive competitor ads, zero direct customer data |
| Mobile Application (iOS / Android) | High repeat engagement, push notification re-engagement, biometric login convenience | High upfront engineering costs; significant friction in getting users to install and keep apps |
| Social Commerce | Zero-click impulse discovery and purchase directly in entertainment feeds | Vulnerability to algorithmic fluctuations and platform policy changes |
| B2B Resellers & Affiliates | Rapid geographic reach into established accounts via trusted intermediaries | Lower gross margins, shared channel control, risk of channel conflict |
| Direct Enterprise Sales | High annual contract values (ACV), multi-year commitments, executive relationships | High Customer Acquisition Cost (CAC) and lengthy 6-to-12 month sales cycles |
Direct, Indirect, or Hybrid? Direct-to-consumer (DTC) distribution preserves margins and first-party data, but places the entire customer acquisition burden on your marketing team. Indirect distribution via marketplaces or distributors unlocks rapid scale, but eats 15–30% of your gross revenue. Most mature businesses adopt a hybrid omnichannel strategy: prospects might discover your brand on social media or search, evaluate solutions on your website, and complete transactions wherever it is most frictionless for them.
Place Example — Artisanal Bakery: An artisanal bakery wanting to scale beyond foot traffic without financing physical retail branches combines multiple channels: (1) Its own responsive web shop capturing full margins on custom cake subscriptions; (2) Local food delivery apps (DoorDash/UberEats) treating commission as marketing acquisition cost; (3) Instagram and WhatsApp catalogs for direct ordering; and (4) Pre-order pickup lockers that reduce retail bottlenecks during morning peaks.
4. Promotion: How Will Customers Learn About Your Business?
Promotion encompasses all marketing communication activities designed to build awareness, demonstrate product value, educate target buyers, and persuade them to take action. Even a revolutionary product with optimal pricing and ubiquitous distribution will stagnate if target prospects do not know it exists. Remember: in the CB Insights data, 14% of failed startups explicitly attributed their demise to poor marketing and promotional execution.
Promotional Channels and Industry ROI Benchmarks
Modern promotional strategy integrates multiple digital and traditional channels with clear performance expectations:
| Promotional Channel | What It Excels At | Key Benchmark Worth Knowing |
|---|---|---|
| Search Engine Optimisation (SEO) | Captures high-intent prospects actively seeking answers and solutions | The #1 organic Google result captures 27.6% of all clicks; the top 3 results capture 54.4% (Backlinko) |
| Email Marketing | Nurtures warm leads, drives re-engagement, and maximizes retention | 35% of marketers report $10–$36 ROI per $1 spent; another 30% report $36–$50 per $1 spent (Litmus 2025) |
| Social Media Marketing | Top-of-funnel discovery, brand social proof, and community dialogue | 82% of consumers use social platforms to discover and research new products (Web Tonic) |
| Content Marketing & AI Blogs | Answers buyer questions, establishes topical authority, and fuels SEO | Generates 3x more leads than outbound marketing at 62% lower cost (Content Marketing Institute) |
| Paid Search & Social Ads | Instant, laser-targeted market visibility and rapid campaign testing | Traffic ceases immediately when ad spend stops; requires strict Customer Acquisition Cost (CAC) monitoring |
| Affiliate & Referral Programs | Leverages borrowed trust from industry creators, bloggers, and customers | Pure performance marketing: commissions are paid strictly upon verified conversions |
| PR & Industry Partnerships | Earns brand credibility, tier-one editorial backlinks, and co-marketing reach | Difficult to attribute directly; measure via branded search volume and referral traffic |
Email ROI by Industry: Litmus's annual benchmarks highlight extraordinary returns across sectors: 45:1 in retail and e-commerce, 42:1 for agencies, 36:1 in software and technology, and 32:1 in media and publishing.
Owned, Earned, and Paid Media Framework
A balanced promotional portfolio blends three media categories to ensure resilience:
- Owned Media: Assets you own and control completely (your website, blog articles, newsletter list, YouTube channel). While slower to establish, owned media compounds over time and represents your lowest long-term acquisition cost.
- Earned Media: Organic word of mouth, unbiased product reviews, social mentions, press coverage, and customer referrals. Earned media is the most trusted by buyers, but cannot be bought directly.
- Paid Media: Search ads (Google Ads), social ads (Meta, LinkedIn), sponsored newsletters, and paid influencer collaborations. Paid media provides instant scalability, but stops generating traffic the moment the budget is turned off.
Matching the Promotional Message to the Funnel Stage
| Funnel Stage | Buyer's Psychological Mindset | Most Effective Promotional Tactics |
|---|---|---|
| 1. Awareness | "Do I have a problem worth solving, and what is causing it?" | Educational blog guides, short vertical videos, organic SEO rankings, social infographics |
| 2. Consideration | "Which approach or software solution is best for my situation?" | In-depth comparison guides, downloadable templates, interactive calculators, webinars |
| 3. Decision | "Is this the right provider, the right timing, and fair pricing?" | Free trials, live product demos, ROI case studies, risk-free guarantees, verified customer testimonials |
| 4. Retention | "Should I continue subscribing, renew my contract, or buy again?" | Automated onboarding email sequences, feature release notes, loyalty rewards, proactive customer success |
The Overlooked Power of Retention Promotion
Most marketing budgets obsess exclusively over top-of-funnel customer acquisition. Yet promotional retention is consistently the single most profitable investment in the marketing mix:
- Bain & Company's Landmark Finding: Increasing customer retention by just 5% increases operating profits by 25% to 95% (Harvard Business Review).
- Acquisition vs. Retention Cost: 82% of companies agree that retaining an existing customer is significantly cheaper than acquiring a new one (Econsultancy).
- Small Business Revenue Concentration: 61% of small businesses generate more than half of their entire annual revenue from repeat customers (BIA Advisory Services).
- Automated Win-Backs: Automated abandoned-cart and churn win-back email sequences routinely achieve 39% to 45% open rates (Web Tonic).
A Practical Example: Applying All 4 Ps to AI Digital Genius
The 4 Ps framework is not limited to physical manufacturing or traditional retail; it applies with equal precision to digital platforms and modern AI applications. Let us examine how AI Digital Genius coordinates all 4 Ps into an interconnected growth engine:
| 4 Ps Element | AI Digital Genius Approach | Strategic Objective | Primary North Star Metric |
|---|---|---|---|
| Product | Free AI Marketing Plan Generator, AI Writing Tool (Blog Generator), developer utilities, and comprehensive guides | Help founders, marketers, and creators complete practical marketing strategies and rankable content 10x faster | Tool completions per session, 30-day returning user rate |
| Price | 100% free access to core generators with optional premium tier upgrades | Eliminate all signup friction to build maximum user trust and market adoption | Visitor-to-registered conversion rate, premium upgrade rate |
| Place | High-performance web app optimized for instant access across mobile, tablet, and desktop | Allow any user to generate a marketing plan or blog post in any browser without installing software | Mobile vs. desktop completion parity, Core Web Vitals speed scores |
| Promotion | High-intent programmatic SEO, deep framework guides, educational video tutorials, and social snippets | Attract organic search visitors actively researching marketing strategy, demonstrate tool value immediately | Organic search traffic growth, guide-to-tool click-through rate (CTR) |
The Reinforcing Flywheel: In this digital marketing mix, each P strengthens the others. An educational blog article explaining marketing mix strategy (Promotion) contains direct interactive CTAs to the free Marketing Plan Generator (Product). Because the core tool requires no credit card (Price) and runs natively in any browser tab (Place), friction between discovery and execution is virtually zero. Every touchpoint turns passive readers into active users.
How to Create a Marketing Strategy Using the 4 Ps (7-Step Process)
Understanding the theory is helpful, but commercial value comes from executing the 4 Ps systematically:
Step 1: Define Your Target Audience with Precision
Identify the exact segment most likely to need and pay for your offering. Profile their day-to-day responsibilities, core pain points, preferred discovery channels, budget constraints, and price sensitivity. Never target "everyone": narrow, well-defined positioning makes every downstream decision simpler.
Step 2: Craft Your Core Value Proposition
Synthesize in one concise formula what your product does, for whom, and why it is superior to existing alternatives:
Step 3: Select Your Pricing Architecture
Calculate your fully loaded unit delivery costs, audit competitor pricing benchmarks, and quantify the tangible financial value delivered to customers. Select a structure (one-time license, subscription tier, usage-based, or freemium) that mirrors customer buying preferences while safeguarding healthy margins.
Step 4: Architect Your Distribution Channels (Place)
Audit where your target buyers naturally search, compare, and purchase solutions. Start with the one or two distribution channels where your audience is most concentrated and that you can operate with excellence, before expanding into multi-channel partnerships.
Step 5: Build a Multi-Stage Promotional Plan
Assign specific marketing channels to each stage of the customer journey (Awareness, Consideration, Decision, and Retention). Establish realistic budget allocations and test acquisition efficiency using our free marketing plan builder.
Step 6: Perform a Strategic Cohesion Check
Review your decisions side by side. If you are developing an ultra-premium product, but pricing it with deep discounts and selling through discount retailers, your marketing mix is sending contradictory signals. Align every element to reinforce a singular brand message.
Step 7: Establish Measurable KPIs & Iterate
Set empirical metric targets for each P and conduct scheduled monthly or quarterly reviews. Compare performance against proven industry reference benchmarks.
KPIs to Track for Each of the 4 Ps
| Element | Key Performance Indicators (KPIs) | Industry Reference Point |
|---|---|---|
| Product | Customer Satisfaction (CSAT), Net Promoter Score (NPS), active feature adoption, return/refund rate | Monitor internal trend over time; target 50+ NPS in software and <5% return rate in retail |
| Price | Checkout conversion rate, Average Order Value (AOV), gross margin %, free-to-paid upgrade rate | Freemium SaaS average: ~2.6% free-to-paid conversion (First Page Sage / Nalpeiron) |
| Place | Traffic and GMV by channel, channel acquisition cost, checkout abandonment %, mobile vs. desktop conversion | Mobile ~1.8% vs. desktop ~3.0% conversion rate (Web Tonic 2026) |
| Promotion | Click-Through Rate (CTR), cost per lead (CPL), Customer Acquisition Cost (CAC), Return on Ad Spend (ROAS) | Email marketing: $36–$45 returned per $1 invested (Litmus) |
| Overall / Retention | Repeat purchase rate, Customer Lifetime Value (CLV), annual churn rate, CLV-to-CAC ratio | A 5% increase in customer retention lifts profits by 25% to 95% (Bain & Company); target 3:1+ CLV:CAC |
The 4 Ps Planning Worksheet
Use this copyable template to audit or build your organization's marketing mix:
| Marketing Mix Element | Our Strategic Decision | Why It Fits Our Target Audience | How We Will Measure Success |
|---|---|---|---|
| Target Audience | [Define primary buyer persona and core pain point] | [Explain why this group has urgent need and willingness to pay] | [Market share, total addressable audience reach] |
| Product | [Core feature set, quality standards, branding, support model] | [How the solution eliminates specific user friction] | [CSAT, feature adoption rate, user retention] |
| Price | [Chosen strategy: value-based, freemium, tiered subscription] | [Alignment with buyer budget and quantifiable ROI] | [Gross margin %, conversion rate, free-to-paid %] |
| Place | [Website, native mobile app, digital marketplaces, partners] | [Where your target buyers naturally look for solutions] | [Channel sales volume, cart abandonment %, mobile conversion] |
| Promotion | [SEO content, social campaigns, automated email sequences, paid search] | [How prospects discover and evaluate solutions at each funnel stage] | [Blended CAC, organic search traffic, ROAS, email open rates] |
Common Mistakes Businesses Make with the 4 Ps
Even seasoned marketing teams frequently stumble when coordinating the marketing mix. Here are eight critical mistakes and how to avoid them:
| Common Mistake | Why It Destroys Value | What to Do Instead |
|---|---|---|
| 1. Building features instead of solving needs | "No market need" causes 42% of startup failures (CB Insights) | Rigorously validate problems with target customers before writing code or manufacturing |
| 2. Competing strictly on price | A 1% price cut erodes operating profits by roughly 8% (McKinsey) | Compete on product outcomes, superior service, or speed; discount only strategically |
| 3. Choosing channels because they are trendy | Marketing expenditure and effort are squandered where your buyers do not spend time | Anchor channel selection in verified customer discovery behavior and purchase patterns |
| 4. Neglecting the mobile experience | Mobile carries 78% of web traffic but converts at half the desktop rate | Test every signup, funnel step, and payment checkout on mobile devices first |
| 5. Treating promotion as the entire strategy | Even brilliant ad campaigns cannot compensate for an unviable product, bad pricing, or broken distribution | Audit all four Ps holistically before scaling advertising budgets |
| 6. Over-indexing on acquisition over retention | Acquiring new users is up to 5x more costly than keeping existing buyers | Dedicate substantial budget and focus to onboarding, automated retention, and win-back emails |
| 7. Ignoring continuous customer feedback | Customer needs evolve; 73% of buyers expect brands to adapt to their changing needs | Deploy quarterly CSAT surveys, review cancellation feedback, and run churn post-mortems |
| 8. Failing to track empirical KPIs | Without telemetry, you cannot isolate which strategic decisions are succeeding or failing | Assign 1 to 2 clear North Star metrics to each P and review them on a predictable cadence |
The 4 Ps vs. the 7 Ps vs. the 4 Cs
While the 4 Ps remain the gold standard framework for general marketing and product launches, two respected frameworks build upon its foundation:
1. The 7 Ps Framework (Services Marketing)
Developed by Bernard Booms and Mary Jo Bitner in 1981, the 7 Ps expand the original model to account for service-based businesses, agencies, hospitality, and professional consulting where the human delivery is inseparable from the product itself. The three additional Ps are:
- People: The customer-facing personnel, account managers, and support engineers who deliver the service and represent the brand.
- Process: The workflows, delivery methodologies, and operational systems that ensure a smooth, repeatable client experience.
- Physical Evidence: The tangible cues that reassure clients of service quality (e.g., modern offices, professional case study documentation, verified certifications, clean website design).
2. The 4 Cs Framework (Customer-Centric Perspective)
Introduced by Robert Lauterborn in 1990, the 4 Cs invert the traditional business-centric 4 Ps into the buyer's perspective:
- Customer Needs (vs. Product): Shift focus from building features to solving real human problems.
- Cost to the Customer (vs. Price): Consider the total economic, time, and emotional cost of adoption, not just the sticker price.
- Convenience (vs. Place): Make discovery, evaluation, and buying as effortless as possible across all devices and platforms.
- Communication (vs. Promotion): Replace one-way advertising shouting with engaging two-way dialogue and education.
| Framework | Core Elements Included | Underlying Perspective | Ideal Use Case |
|---|---|---|---|
| 4 Ps | Product, Price, Place, Promotion | Internal business decision-making | Physical goods, software product launches, general marketing plans |
| 7 Ps | 4 Ps + People, Process, Physical Evidence | Operational service delivery | Marketing agencies, consulting firms, healthcare, hospitality, enterprise support |
| 4 Cs | Customer Needs, Cost, Convenience, Communication | The buyer's holistic experience | Auditing marketing strategies to ensure plans make compelling sense from the buyer's side |
Frequently Asked Questions About the 4 Ps of Marketing
1. What are the 4 Ps of Marketing?
The 4 Ps of Marketing are Product, Price, Place, and Promotion. They represent the foundational elements of the marketing mix, guiding businesses on what solution to build, how much to charge, which distribution channels to use, and how to promote the offering to generate sales.
2. Who created the 4 Ps of Marketing?
Professor E. Jerome McCarthy introduced the 4 Ps in his 1960 marketing textbook Basic Marketing: A Managerial Approach. He synthesized Harvard professor Neil Borden's earlier concept of the "marketing mix" into four memorable operational categories.
3. Why are the 4 Ps important for modern businesses?
The 4 Ps provide a comprehensive structural framework that prevents blind spots. Businesses that focus solely on promotion frequently fail due to flawed pricing models or inadequate distribution channels. The 4 Ps ensure all four pillars work in synergy around the target customer.
4. What is a clear example of the 4 Ps in action?
An online office-wear store offers wrinkle-resistant shirts and tailored trousers (Product), priced accessibly for entry-level professionals with three-item bundle discounts (Price), sold through its direct web shop and Instagram Shop (Place), and marketed via SEO guides on interview dressing and LinkedIn sponsored video ads (Promotion).
5. How do the 4 Ps work together in a marketing plan?
The 4 Ps function as an interconnected system. A premium product requires an elevated price point, selective distribution channels, and sophisticated promotional messaging. If any single P contradicts the others (such as discount bargain pricing on a luxury item), customer trust and profitability suffer.
6. Which of the 4 Ps has the biggest impact on profit?
Price. McKinsey & Company research found that a 1% improvement in price delivers an 8% lift in operating profit—nearly 50% more impact than a 1% cut in variable costs and more than triple the impact of a 1% increase in unit sales volume.
7. How can the 4 Ps help increase customer retention in marketplaces?
By coordinating product quality, transparent pricing, seamless order fulfillment (place), and proactive retention promotion (loyalty rewards, back-in-stock alerts, and automated win-back emails). Research by Bain & Company demonstrates that increasing customer retention by 5% lifts operating profits by 25% to 95%.
8. How do you apply the 4 Ps when creating a social media platform?
Design the core community UX around a single acute interaction need (Product), offer free consumer access supported by targeted advertising or creator subscriptions (Price), launch with native mobile iOS/Android apps and frictionless web sharing (Place), and seed early adoption through niche creator beachheads and viral loops (Promotion).
9. Are the 4 Ps still relevant to digital marketing in 2026?
Yes. While the tactical channels have transformed from print circulars and physical retail aisles to algorithmic SEO, cloud APIs, and mobile checkouts, every commercial enterprise must still decide what it provides, what it charges, where it is accessed, and how it communicates value.
10. What is the difference between the 4 Ps and the marketing mix?
The marketing mix is the overarching concept representing the combination of tools and tactics a business uses to take an offering to market. The 4 Ps is the most widely adopted and practical operational framework used to structure and categorize that marketing mix.
Final Thoughts: Building Your Actionable Marketing Mix
The 4 Ps of Marketing provide an enduring foundation for building, stress-testing, and scaling any business strategy:
- Product defines what you offer and ensures it directly eliminates real customer pain points.
- Price determines what customers exchange, serving as your most powerful profit lever.
- Place establishes frictionless distribution, meeting buyers where they already research and spend money.
- Promotion communicates your unique value proposition, acquiring qualified leads and keeping customers coming back.
The highest-performing companies never view these four elements in silos. They align all four Ps to tell a unified, compelling story to a well-defined audience. Take the 4 Ps Planning Worksheet above, establish one or two concrete KPIs per element, and review your metrics regularly.
Ready to Turn Your Marketing Ideas into an Actionable Strategy?
Organise your audience research, pricing strategy, distribution channels, and promotional campaigns into a professional, data-backed execution document in minutes.
Sources & Academic References
- McKinsey & Company, "The Power of Pricing": Analysis of S&P 1500 companies on 1% price adjustments and operating profit.
- CB Insights Startup Post-Mortems (via CMO Council & Quake Capital): Top reasons for startup demise.
- Salesforce Research, "State of the Connected Customer": Customer expectation benchmarks.
- SaleHoo & eMarketer: Worldwide Retail Ecommerce Forecast and global online sales projections.
- Web Tonic (2026): 127 Online Shopping Statistics: mobile commerce share, social discovery, and abandoned-cart benchmarks.
- Wiser Review: US Social Commerce Market Analysis and projections.
- Harvard Business Review (summarized via Accelerated Analytics): Empirical study of 46,000 retail omnichannel shoppers.
- Backlinko: Google Organic Click-Through Rate (CTR) Distribution Study.
- Litmus, "State of Email & The ROI of Email Marketing": Multi-industry return on investment benchmarks.
- Nalpeiron (summarizing First Page Sage SaaS Benchmarks): Organic conversion metrics across freemium and trial tiers.
- Bain & Company (via SmartBrief, Loyalty360, and Mailmodo): The impact of customer retention on business profitability.
Expert Resources & References
Foundational Marketing_Frameworks
- Neil Borden and the Marketing Mix History
Historical overview of the original marketing mix concept formulated at Harvard Business School.
- McKinsey & Company: The Power of Pricing
Empirical study illustrating how a 1% improvement in price delivers an 8% lift in operating profits.
- Bain & Company: Prescription for Cutting Costs
Research proving that a 5% increase in customer retention raises operating profits by 25% to 95%.
- Harvard Business Review: A Study of 46,000 Shoppers
Research confirming omnichannel customers spend 4% more in store and 10% more online.
Free Marketing_Tools_and_Guides
- Free AI Marketing Plan Generator
Turn your 4 Ps research into a complete, multi-channel actionable marketing plan with AI.
- Marketing Plan Guide, Template & Examples
Step-by-step tutorial on building a marketing plan with free copyable templates.
- Free AI Writing Tool & Blog Post Generator
Generate high-ranking promotional blog articles and SEO content in seconds.
- SEO Content Writing Guide
Master organic search acquisition and keyword optimization to fuel your promotional mix.
Ready to Create Your Marketing Plan?
Use our free AI-powered marketing plan generator to create a comprehensive, data-driven marketing strategy tailored to your business.
Generate Your Marketing Plan